Three Tips in Google Analytics
Google Analytics are awesome.
They're free, easy to set up, and tell you everything you need to know about how your website is performing.
But, they also encompass a confusing array of data, can be time-consuming to set up, and involve a dictionary of Google-speak. (What is a visit versus a pageview anyway?)
Don't worry if you don't have hours to dive into this. Here are three key stats to look at to see if your site is on track at the highest level.
Mobile %
The percentage of website traffic coming from mobile devices jumped from 17.5% in Q3 2012 to 23.1% in Q4 2012, according to a new report from Walker Sands. On the Vin65 platform, our clients average about 17%. To find out what yours is:
- Select Audience
- Select Mobile
- Select Overview
- Choose your viewing option. We chose the pie chart.

Implication? This example shows a smaller viewership - only 4.4% are on mobile. But if you are one of the wineries where 1 out of every 5 of your customers are on a mobile device, you better make sure that your mobile site and cart are optimized or you could be losing valuable sales.
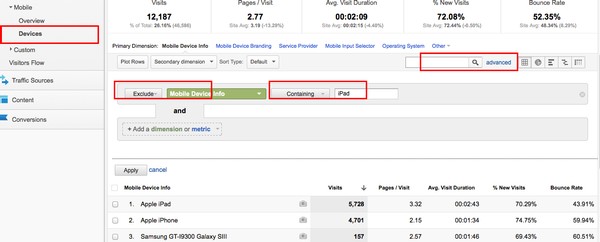
To take this a step further, drill down to remove iPads. Why? Because iPads are "mobile" in the Google Analytics world but tend to use computer monitor resolution. So if you're trying to see if you need to redesign your site for the small screen, this is important.
To do this:
- Select Devices
- Select advanced search
- Select Exclude, then choose Mobile Device Info
- Type in iPad

Home Page Traffic Flow
Did you know that things like static home pages and flash movies can stop up to 95% of your traffic on your home page? One of the cooler visual stats in Google Analytics is the Visitors Flow view. To access this area:
- Select Audience
- Select Visitors Flow
- Look at starting page drop off by clicking on the red area visualizing the drop offs

Implication? This example isn't too bad - but 20% of all traffic that started on this home page left. What are your numbers? You could be working hard to drive traffic to your site, and then traffic leaves after the first page. So, either your visitors are finding what they want right away...or or you've lost them.
Social Media Traffic
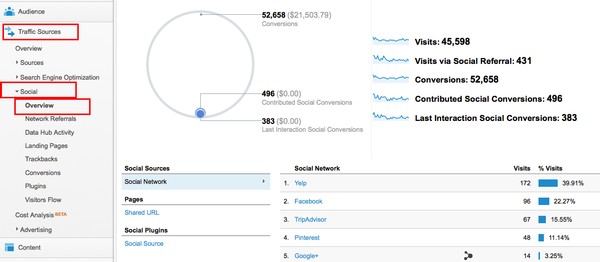
Many of us spend large amounts of time worrying about Social Media. But is it doing anything for your business? Here is one of the simplist ways to answer that question.
- Select Traffic Sources
- Select Social
- Select Overview
- Look at what social media channels are driving visits to your site

Implication? You can see if the work that you're spending on various Social Media channels is driving traffic to your site, and then adjust accordingly. This is the tip of the iceberg in the Social Arena, to be sure. In this example there are also conversion goals attached to the shopping cart, and you can put specific Social urls in here as well. But at a high level, this will tell you if you're making an impact.
So, don't be afraid, dive in to these, and more Google Analytics, and keep your site on track working hard toward your goals.